Milieuzaken.org
feiten, getallen en opinies  

Ijstijden

U bent hier: inhoudsopgave - ijstijden

Afkorting of begrip onbekend ? Raadpleeg ons milieuwoordenboek !

en Facebook of Linkedin

Google
 
Web www.hugovandermolen.nl

Global Temperatures

During the last couple of decades, much work has been done to try to determine earth's average temperature over a long period of time. One of the ways this is done is by drilling ice samples in Greenland and determining from the layers of ice (much like tree rings) what gases are present and what the average temperature was that year.

Unfortunately, this record over Greenland appears to give valid readings only up until the last inter-glacial period. Luckily enough, the drill records for the Antarctic have recently revealed records over the last 400 thousand years.


Temperature variations over the last
400.000 years showing 4 inter-glacial periods
ijstijdencyclus

(source: https://www.exploratorium.edu/climate/cryosphere/data2.html)

Consider this chart of temperatures over a 400 thousand year time period recently gained from ice cores in the Antarctic. Please read from left to right. It starts at current temperatures and goes back in time. It shows the recent spike that marks the end of the last glacial period. Notice the cold periods extend for about 100.000 years and there are 4 warm spikes approx. every 100.000 years that last for an average of 10.000 years. These correspond with readings taken in Greenland over the period of time that Greenland can be measured and are viewed as reflective of overall climate on Earth.

Any description of global warming will have to address the temperature's cyclical nature over the last 400.000 years.

Extent of Glaciers

Ice coverage of the northern hemispere 18.000 years
before present compared to modern day


left: earth 18.000 years ago as viewed from the north pole ||||||||||||||| right: earh today as viewed from the North Pole
Het zeeijs is paars gekleurd

ijsbedekking

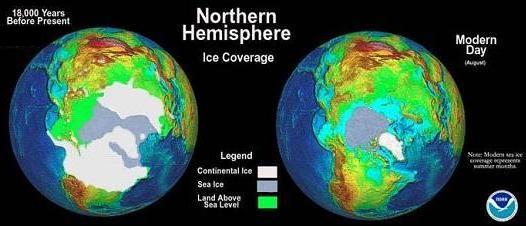
(source: https://www.magazine.noaa.gov/stories/mag95.htm)

Consider these pictures showing ice levels (white and light blue) towards the end of the last glacial period (about 18k years ago) compared to ice levels now (an inter-glacial period). The world was very different, with the ice covering New York, Toronto, Edmonton, Calgary, ... in the 1-2 kilometer range. The sea level was some 100 meters lower than present and the shore lines were closer to what is called the continental shelf, rather than current ocean shore lines. Notice also the land bridge between Alaska and Russia (light green) that facilitated the movement of humans into the Americas from Asia during the last glacial period.

Any description of global warming will have to address the issue of the last 10k years that shows a dramatic reduction in ice buildup over Canada and northern Europe.

During the period of polar ice cap melting, consider the Atlantic Ocean. Most of the cold, fresh water created by the melting flows out through the North Atlantic. Very little comes out to the Pacific just because of how the land is. Remember the movie Red October, where submarines use the rush of cold water deep in the ocean between Iceland and England to travel quickly into the mid Atlantic Ocean. This rush of deep cold fresh water causes a current that forces the surface warmer water to flow north towards Europe and estabilishes most of the overall ocean currents. The warm weather in northern Europe and eastern Canada contributes to and intensifies the melting of the ice cap, which in turn intensifies the warmer northern weather, thus causing more melting, more flow of water and warmer weather yet.

This cycle clearly cannot continue forever. At some point enough of the polar ice cap has melted so that there is no longer such a large net flow of cold water out of the Arctic. At this point the northern flow of warm water on the surface and the warm air flowing into Northern Europe will be reduced. Instead of melting, the Arctic will again start to build up ice. The slow 100k glacial period will start and the buildup of ice will continue over the 100k years since there is no more north Atlantic current to melt the ice. The feedback loop of melting causing warm weather is now replaced with freezing of the ice cap causing cooler weather. The ice cannot build up forever, as the earth absorbs too much energy from the sun to completely freeze up. So at some point, the build up of ice is enough that it starts to melt even though the north Atlantic is not warming it. At that point, the north Atlantic will again start the warming feedback loop and the cycle of dramatic warming (10k years) followed by slow freezeup (100k years) will continue.

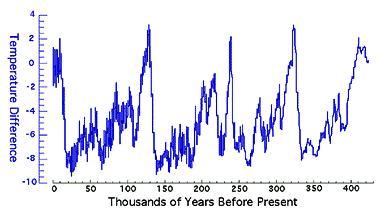
Remember too, although the buildup of ice takes a long time, the actual temperature changes in a particular place caused by the flow of the ocean occur on a much smaller time frame. The temperature charts show differences ranging from 2 degrees to 10 degrees celsius occuring over a relatively short time frame (ie. decades). The principle change will come in the flow of the Atlantic Ocean and the related weather changes caused by no more gulf stream affecting the weather in Eastern Canada, the Eastern US and Northern Europe.

Conclusions

The earth has a natural warming and cooling cycle that lasts just over 100 thousand years. The cycle goes from virtually no ice in the arctic, to substantial buildup of ice in the arctic. The complete melting of the polar ice cap is what triggers the next round of cooling. The natural flow of the Atlantic Ocean is what sustains the warming and cooling cycles.

The sea level would rise another 6.5 meters if most of the ice on Greenland melts (as it did in the last and every other interglacial period). Also remember that the melting of the ice shield over North American and Europe over the last 10k years has raised sea levels by an estimated 120 meters. How long before all of the Greenland ice melts and sea levels rise another 6 meters? 500 years? 200 years? What will happen after it melts? Will the Atlantic ocean current reverse causing considerably cooler temperatures for a long time in places like Northern Europe, Toronto and New York?

There exists a clear record of what has happened in the past. Will it happen again? We need to know.

Is Canada Ready...

Bron en Copyright © 2009 IsCanadaReady.Com, All rights reserved.

Hoe mensen op het noordelijk halfrond 20.000 jaar geleden, dus aan het einde van de laatste ijstijd, leefden, en vooral jaagden, wordt fantasievol getoond in de fraaie film "Alpha" van regisseur Albert Hughes uit 2018. Zie hier voor de trailer van deze film, waarin de eerste wolf wordt gedomesticeerd. In de film steken ze zich wel erg fraai in de kleren......


Het einde van de laatse ijstijd door herbebossing van de poolregio ?
Het einde van de laatste ijstijd zou zijn veroorzaakt door herbebossing in de poolregio op het noordelijk halfrond:
Onderzoekers van de Carnegie Institution in Washington stellen dat prehistorische jagers zoveel mammoets (herbivoren = planteneters) heben gedood, dat in de poolregio berkenbossen konden ontstaan. Daardoor kon de (ooit besneeuwde) grond niet langer het zonlicht weerkaatsen: de witte sneeuw maakte plaats voor een donker zonlichtabsorberend landschap en zette zo een cyclus van opwarming in gang, al lang voordat de mammoet definitief was uitgestorven (bron: FD, 16-7-2010).


De Kleine Ijstijd: ca. 1580 - 1850, met dieptepunt van ca. 1650-1705 à 1710, volgens sommigen tot 1725.


In het boek The Little Ice Age wordt echter de periode 1300 - 1850 genoemd. ------------------------------->

Hier onder wordt gesproken (eigenlijk geschreven) over de periode 1580-1850, met met als dieptepunt het Maunder Minimum (1645 – 1720) toen het in West Europa enkele graden kouder was t.o.v. de relatief warme Middeleeuwen en hedendaagse periode

Kleine Ijstijd

Adriae van de Venne

Adriaen van de Venne schilderde ijstaferelen in de Kleine IJstijd.

Na het zgn. Middeleeuws Optimum daalde de temperatuur om een tijd min of meer gelijk te blijven, totdat tussen 1580 en 1850 een koude tijd optrad, die wel als de ‘Kleine IJstijd’ wordt aangeduid, met als dieptepunt het Maunder Minimum (1645 – 1720; zie grafiek hier onder van 400 jaren zonnevlekken-observaties)) toen het in West Europa enkele graden kouder was t.o.v. de relatief warme Middeleeuwen en hedendaagse periode.

Uit die extra koude periode stammen de talrijke schilderijen van Hollandse ijspret, onder meer van Avercamp (klik hier voor 1 van zijn schilderijen) en Van de Venne (zie schilderij links).
Het Maunder Minium is een aanduiding van een periode van nauwelijks zonnevlekken-activiteit van ca. 1650 - ca. 1705 à 1710 (Kees de Jager, 2009, interview). Anderen laten het doorgaan tot ca. 1725.


Bronnen:
Foto en veel teksten: Prof. Dr. A.J. van Loon in een artikel op kennislink.nl
Hij refereert naar: Osborn, T.J. & Briffa, K.R., 2006. The spatial extent of 20th-century warmth in the context of the past 1200 years. Science 311, p. 841-844.

Bert Amesz in www.klimatosoof.nl d.d. 17-3-2010: 'Stijgt de zeespiegel eigenlijk wel ?".
 

Het Middeleeuws Optimum en de Kleine Ijstijd worden wel in verband gebracht met meer of minder dan gemiddelde activiteit van zgn. zonnevlekken (Eng. sunspots). Zie een videopresentatie.

Onderstaande grafiek is ontleend aan een artikel d.d. 27-4-2018 op www.armstrongeconomics.com

400 jaar observaties van zonnevlekken


Is het begin van de kleine ijstijd (mede) ontstaan door herbebossing ?
De kleine ijstijd  (https://nl.wikipedia.org/wiki/Kleine_ijstijd) zou volgens de Amerikaan William Ruddiman wel eens door herbebossing veroorzaakt kunnen zijn !  Dit nadat in China (al vanaf 1334) wel 2/3 en in Europa (tussen 1347 en 1350) 30 à 40 % der bevolking was gestorven aan de pest, de zgn. Zwarte Dood, en daardoor de ontbossing stopte en de natuurlijke herbebossing weer zijn gang kon gaan ! In 2003 schreef hij een artikel in het tijdschrift Climate Change waarin hij aannemelijk maakte dat de mens al duizenden jaren bezig is het klimaat te beïnvloeden, vooral door ontbossing ten behoeve van landbouw en veeteelt.
Paleo-ecoloog Tom van Hoof, vorig jaar gepromoveerd in Utrecht, deed onderzoek dat die stelling wel wat ondersteunde. Zijn conclusie: De link tussen de Zwarte Dood en de CO2-daling staat niet vast, maar lijkt wel redelijk aannemelijk. Kan die daling op zijn beurt de Kleine IJstijd hebben veroorzaakt? In ieder geval niet in zijn eentje, zegt Van Hoof. "Maar het zou wel kunnen dat dit een zetje aan het klimaat heeft gegeven, waardoor ook andere mechanismen zijn gaan bijdragen aan de afkoeling. Welke, dat weten we nog niet."


Literatuur:

-Bijkerk, André, De Kleine Ijstijd van 1945-1974, Climategate, 15-9-2015

- Electroverse, (A FEW OF THE) SCIENTISTS WHO WARN OF A COMING GRAND SOLAR MINIMUM AND LITTLE ICE AGE, Electroverse.net, 10-9-2020

- Frost fairs, Sunspots and the Little Ice Age, To be published in A&G, Astronomy and Geophysics, March 2017 (link verbroken ? kijk dan hier)


U bent hier: inhoudsopgave - ijstijden
Google
 
Web www.hugovandermolen.nl

Deze website is een activiteit van dr. Hugo H. van der Molen, Copyright 2007 e.v.

Mail ons uw commentaar, aanvullingenen en correcties !

en Facebook of Linkedin