Total world production/consumption (as of 2005) is approximately 84 million barrels per day (= Mbbl/d)
1 barrel (American) = 158,984 liter = 42 USA Gallons
(bron: http://dictionnaire.sensagent.com/petroleum/en-en/#definitions)
About 10% of this volume pertains to fossile liquid fuels from tar sands, natural gas etc.
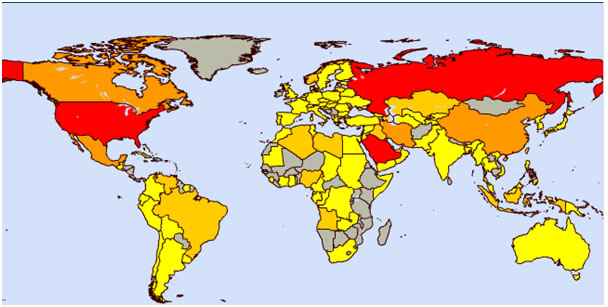
World map of oil producing countries: the darker the colour, the more oil is being produced.
Source:
http://worldofsurvival.nl/peakoil.html, d.d. 15-12-2011
OPEC
De OPEC - Organisation of Oil Exporting Countries established on Sseptember 14th 1960. Per December 2011 this oil cartel counts 12 member countries. The head office is located in Vienna (Austria).
Oldest members (since 1960) are Irak, Iran, Koewait, Saoedie-Arabia en Venezuela.
In 1961 Quatar joined Opec.
In 1962 Libië and Indonesië, but Indonesië left the cartel in 2008.
In 1967 de VAE - United Arab Emirates: consisting out of seven emirates: Abu Dhabi, Dubai, Sharjah, Ajman, Umm Al Qaywayn, Ras al-Khaimah and Fujairah.
In 1969 Algeria
In 1971 Nigeria
In 1973 Equador (from 1973 - 1992) and again since 2007.
In 1975 Gabon (until 1994)
In 2007 Angola
Opec is per 2011 good for about 40% of the world's oil production
Sources:
FD, dec. 15th 2011
OPEC
Top petroleum-producing countries (Source: Energy Statistics from the U.S. Government.) Oil producing countries, in order of amount produced in 2004 in MMbbl/d & ML/d:
1 peak production of conventional oil already passed in this state 2 Though still a member, Iraq has not been included in production figures since 1998 3 Canada has the world's second largest oil reserves when tar sands are included, and is the leading source of U.S. imports, averaging 1.7 MMbbl/d in April 2006 [4]. |
Top petroleum-exporting countries Oil exports by country, in order of amount exported in 2003:
1 peak production already passed in this state Note that the USA consumes almost all of its own production, while the UK has recently become a net-importer rather than net-exporter. Total world production/consumption (as of 2005) is approximately 84 million barrels per day. |
Top petroleum-consuming countries (jaar ?)
Source: CIA World Factbook |
top petroleum non-producing
Source : CIA World Factbook |
Top petroleum-importing countries (jaar ?)
Source: CIA World Factbook |
Oil producing countries
China
Since ca. 1992 China consumes more oil than it produces. So, imports increase and increasingly so.
Iraq
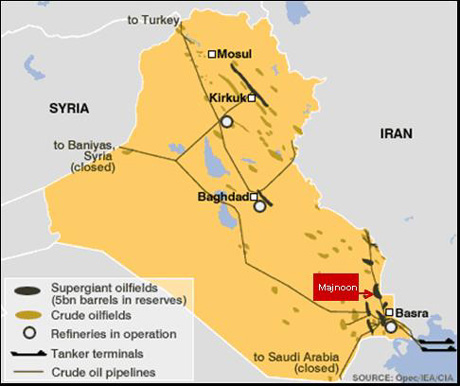
Location of major oil fields.
In Koerdistan alone one estimates in the year 2010 an oil rserve of 45 billion barrels (FD, 6-4-2010)
USA
About 1/4th of its oil consumption comes from Mexico (source FD, 10-11-2009)
U.S. imports from Canada, amounted to 1.7 million barrels / day (MMbbl/d) in April 2006.
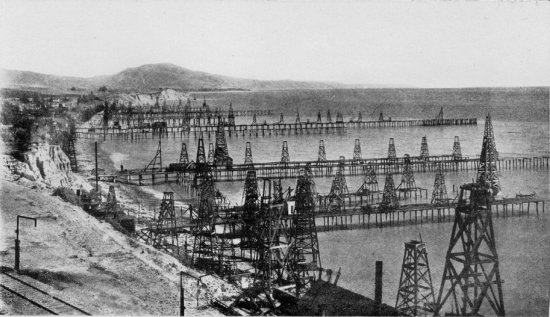
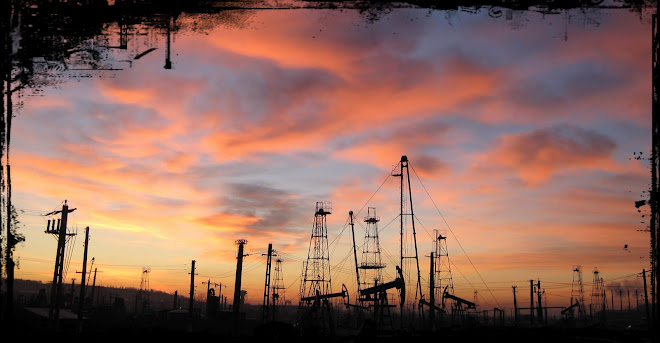
Off shore oil drilling, some hundred years ago at Summerland California (source: Keith Kohl , Energy and Capital, October 30th, 2012).

For historic bonds and shares of oil companies click on separate web pages for companies from:
For a short history and scripophily of Rumanian oil wells, click here !
This website is an activity of Van der Molen Financial Services,
Copyright 2010 f(f): Dr. Hugo H. van der Molen (editor)
Mail us your comments !