Environmental Affairs
Learn more about our environment and invest in it: facts, numbers and opinions
No life without CO2
All life on earth depends on the presence of Carbon Dioxide: without CO2, no life. When we put more CO2 into a green house, the plants will grow better. In the picture is shown how much better fur trees grow if CO2 concentrations are higher than present levels in our natural environment (385 ppm = parts per million).
|
|
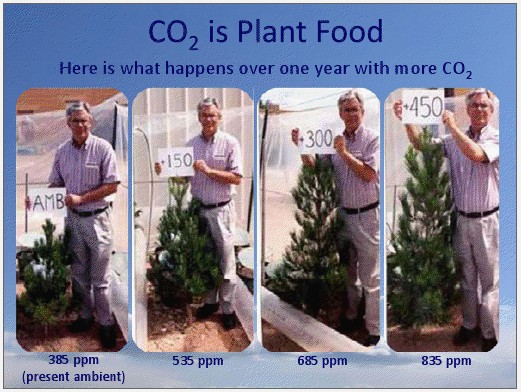 source: Philip R. Wood, vice-president van de Lavoisier Group; source: Philip R. Wood, vice-president van de Lavoisier Group;
found on climategate.nl, d.d. 28-7-2011.
|
Carbon cycle
This cycle can be divided in an organic and inorganic cycle, which in turn can be divided in a short- and a long-term cycle.
The carbon cycle maintains a measure of natural balance between the amounts of carbon present in the atmosphere (CO2), in water (dissolved CO2) and in the biosphere (chalk, mineral oil, natural gas, coal).
However, the balance shifts as conditions and concentration change, for example if levels of CO2 are continuously increasing. An increase of the CO2 concentration in the atmosphere remains mainly unobserved, as it can not be smelled or seen.
An increase of the CO2 concentration in the atmosphere is - at least partly- caused by the combustion of fossil fuels such as mineral oil, natural gas and coal.
:
|
|
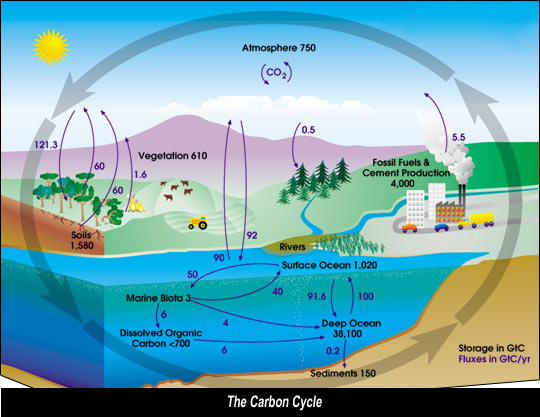
Diagram of the carbon cycle. The black numbers indicate how much carbon is stored in various reservoirs, in billions of tons ("GtC" stands for GigaTons of Carbon and figures are circa 2004). The dark blue numbers indicate how much carbon moves between reservoirs each year. The sediments, as defined in this diagram, do not include the ~70 million GtC of carbonate rock and kerogen. source: http://en.wikipedia.org/wiki/Carbon_cycle |
CO2 concentration in the atmosphere is rising
The graph below shows that the amount of CO2 in our atmosphere has risen since 1850, from ca. 285 parts per million (ppm) to ca. 368 ppm in the year 2000. This coincides with the start of the industrial revolution around 1850, when combustion of fossil fuels started to increase. Since then, the amount of CO2 in the atmosphere has also increased, by ca. 33% in the year 2000.
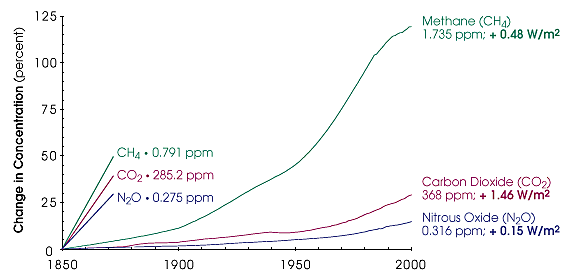
ppm = parts per million
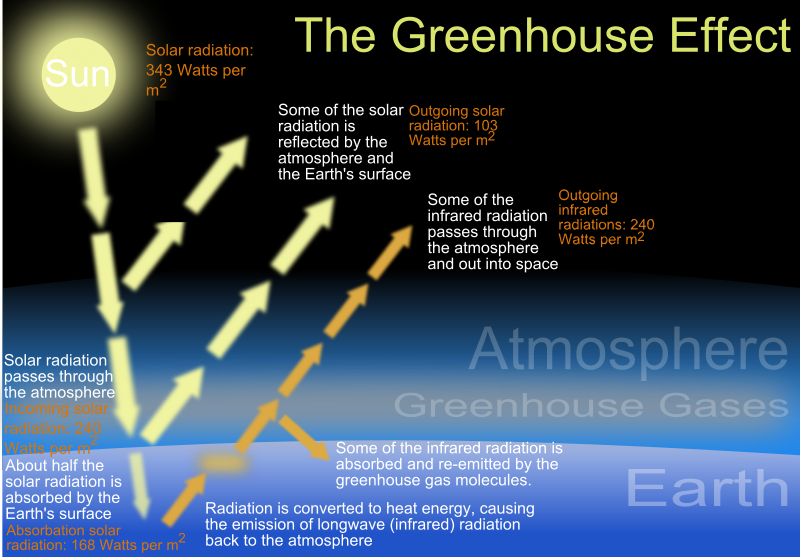
CO2 is called a green house gas
Together with several other gasses (of which water vapor is the most important one), C02 has the property of reflecting back to earth part of the heat waves the earth reflects back into the universe. Gasses with these properties are commonly called greenhouse gasses, and the warming up of the earth by heat wave reflection called greenhouse effect, but unfortunately the comparison with a greenhouse is wrong, what causes misunderstanding of the relevant processes in the public debate. In a greenhouse one prevents the warm air to escape upwards in the sky. Except when it gets to warm: then roof windows are openend to cool off the air. Only then a greenhouse starts to act as the earth: when warmed up, water vapourises and cools down the surface and warm air and vapour rise into the air, cooling the air at the earth surface and the surface itself. Winds will disperse the wamth to cooler earth surfaces, such as the poles. Some of the heat radiated by the earth will be radiated back to earth by the gasses that are commonly called greenhouse gasses (see table below), the most important of which is not CO2 but water vapor. But unlike in a green house, the heat radiated back to earth by water vapour and other gasses (and aerosoles and vulcano dust etc.) is not trapped by a glass roof. It will be dealt with by the normal atmosheric processes that all heat is dealt with. As most of the heat radiated into the universe by the earth is not stopped by green house gasses, the effect of back radiation by these gasses cannot be compared to a green house glass roof either. |
|
|
Another unfortunate metaphore (comparison) is that our atmosphere acts like a blanket: it keeps the earth surface at a comfortable average temperature of ca. 15 degrees Celcius, as this temperature would be ca. minus 18 degrees Celcius without our atmosphere. But the earth's temperature is not equal everywhere on the the globe: it is very warm in the tropics and very cold at the poles. Our atmospheric processes (e.g. vaporisation of water and winds blowing, but also gulf streams in the oceans and seas) cool the earth surface in the tropics and warm up the surface at the poles. So, our atmosphere is a very sophisticated blanket at best: warming up our heads and feet and cooling down our waists, or vice versa..
A carbon dioxide equivalent is a measure to compare the effects of different greenhouse gases. It is based on the Global Warming Potential (GWP), the measure in which a gas contributes to global warming compared to an equivalent mass of CO2.
Methane for example has a GWP of 23, which means that 1 pound of methane has an effect 23 times greater than 1 pound of CO2.
In order, the most abundant greenhouse gases in Earth's atmosphere are:
The contribution to the greenhouse effect by a gas is affected by both the characteristics of the gas and its abundance. For example, on a molecule-for-molecule basis methane is about 72 times stronger greenhouse gas than carbon dioxide over a 20 year time frame but it is present in much smaller concentrations so that its total contribution is smaller. When these gases are ranked by their contribution to the greenhouse effect, the most important are:
Gas
|
Formula
|
Contribution
(%) |
| Water vapor |
H2O |
36 – 72 % |
| Carbon dioxide |
CO2 |
9 – 26 % |
| Methane |
CH4 |
4 – 9 % |
| Ozone |
O3 |
3 – 7 % |
CO2-levels in the course of 600 million years
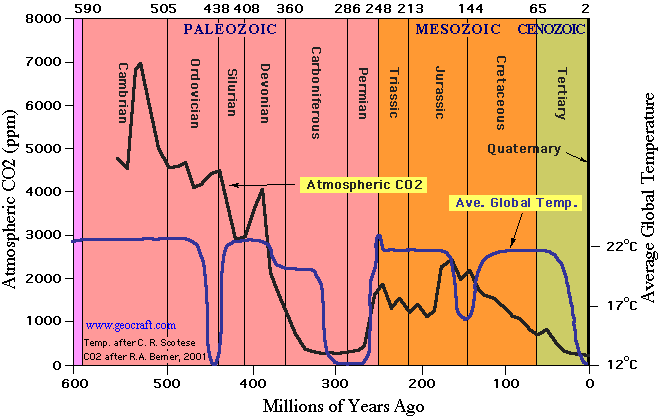
The graph above (by www.geocraft.com) shows how CO2-levels in the atmosphere (black line) have fluctuated in the course of 600 million years: from 7,000 parts pro million (0,7 %) to current levels of about 390 parts per million (0,0390 %) anno 2009, with perhaps a lowest point of 285 parts per million in 1850 (before the industrial revolution) as shown in the graph further above.
Note that when temperature levels (blue line) were at their highest CO2 levels varied between 7000 parts per million and current low levels of ca. 368 parts per million. And when temperatures were at their lowest CO2 levels varied between 4500 parts per million and their current low levels. This suggests that in the time frame of 600 million years there is no correlation between CO2 and temperature on earth. Antropogenic Global Warming sceptics (e.g. Watts, 2009) take this as evidence that there is no correlation between CO2 and temperature on earth. Antropgenic Global Warming adepts argue that this correlation may once not have existed, but that it does nowadays (Tim Stephens, June 6th 2012).
CO2 emission sources
Humans inhale air with the current low percentage of CO2 (ca. 0,039 % anno 2009) but when we breath out our breath contains 4 à 5 % CO2. This, of course, has always been the case with mankind. But mankind is increasing in numbers exponentially. The same holds for other mammals although percentages probably vary.
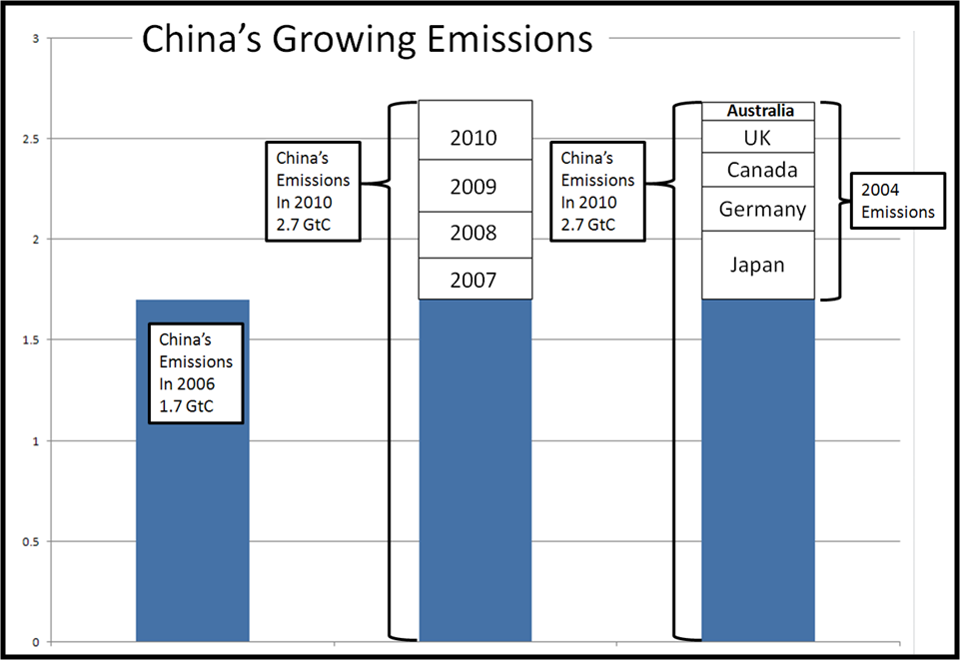
CO2 emissions world wide
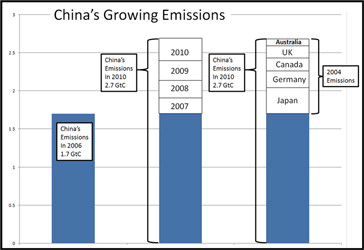
Click on graph for enlargement
|
|
CO2 emissions in China grew from 2006 until 2010 with almost 60%.
A growth as large as the combined annual emissions of Japan, Germany, Canada, UK and Australia, in 2004..
source: Rypke Zeilmaker, Jan. 21st 2013 on climategate.nl). |
Sources:
Sicirec, July 1st 2011
Wikipedia:
------ http://en.wikipedia.org/wiki/Greenhouse_gas, July 1st 2011
This website is an activity of Van der Molen Financial Services,
Copyright 2010 f(f): Dr. Hugo H. van der Molen (editor)
Mail us your comments !